Measurement
01 · Capture
Record the signal, sensor placement, sampling rate and wear time. Retain the information needed to distinguish nonwear from inactivity.

SWISSTEP / KNOWLEDGE LIBRARY
From walking signals to defensible conclusions: measurement, clinical interpretation and the decisions that follow.
Walking is a coordinated motor task and an everyday behaviour. Its measurement can describe capacity, adaptation and participation: how quickly a person covers a known distance, how consistently steps repeat, how the two limbs contribute, and how much walking occurs outside the clinic. The useful endpoint depends on the decision. A rehabilitation team may need change in walking capacity; a neurological study may need medication-related fluctuation; a falls service may need a broader picture of balance, strength and exposure.
A clinic test controls instructions and environment. Daily-life monitoring captures behaviour under variable conditions. The two can diverge without either being wrong: a person may walk well during a short assessment but avoid longer trips at home. Footwear, aids, terrain, turns, fatigue and sensor position affect the observations. Evers and colleagues demonstrate the importance of recording context.
Record the signal, sensor placement, sampling rate and wear time. Retain the information needed to distinguish nonwear from inactivity.
Establish hardware performance and metric accuracy in the intended population and setting before relying on an output.
Identify gait events, derive parameters and compare repeatable patterns over time. Quantify uncertainty and examine missing data.
Draw conclusions from the analysis alongside symptoms, functional goals and clinical findings. Distinguish an observed change from its possible causes.
Choose a proportionate next step, document the rationale and evaluate the response. Monitoring becomes useful when the information changes a well-defined decision.
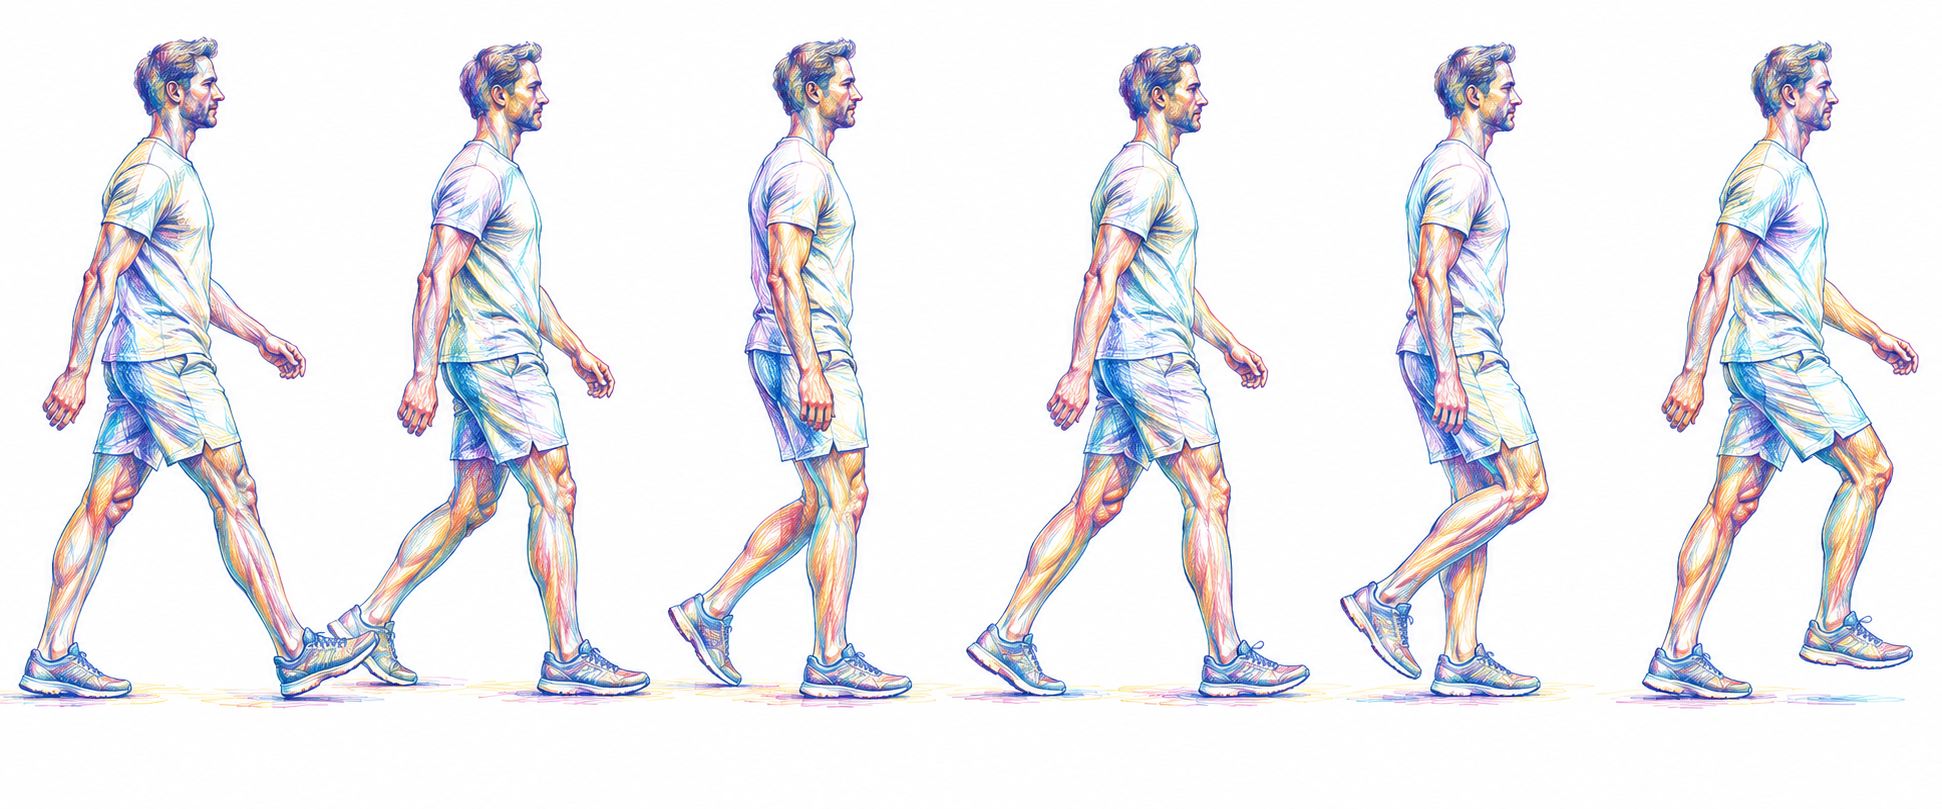
The reference foot meets the ground, beginning the next cycle.
Blue: reference leg · Coral: opposite leg
The display uses an illustrative stance–swing split, not patient data. Timing varies with speed and pathology. Animation starts only when you choose Play. Gait-analysis background and terminology.
The first question is whether the change is credible. Event-detection error, a different walking aid or a shift from long outdoor bouts to short indoor bouts can alter a summary without a corresponding change in physiology. Compare like with like where possible and retain the distribution, not only the mean. A week of measurements is useful only when its coverage and context are known.
Pace combines step length and cadence. A faster gait achieved through longer steps is mechanically different from one achieved primarily through a higher stepping rate. Temporal asymmetry describes unequal timing between limbs; it does not identify whether pain, weakness, restricted range or compensation produced that inequality. Variability describes consistency across repeated cycles and is sensitive to the number and type of strides included. These measures are complementary, not interchangeable indicators of a single “gait quality”. The V3 framework provides the measurement-evaluation foundation.
Separate the observation from the explanation. “Shorter strides during the afternoon” is an observation. Fatigue, medication timing and a different walking environment are hypotheses that need corroboration.
Balance adds another level of assessment. Double-support time describes how long both feet contact the ground; turning characteristics describe a transition rather than steady walking; postural-sway measures describe control during a specified standing task. None supplies a complete account of fall risk. Previous falls, medicines, vision, strength and the environment remain part of a multifactorial assessment. CDC STEADI assessment resources.
Longitudinal observations can help a team recognise a plateau after rehabilitation or a pattern around medication timing. They cannot establish the cause alone. A sustained decline may justify review; it cannot diagnose an implant complication or direct a medication change without clinical assessment. Patient-reported pain, confidence and participation explain aspects of recovery that a motion signal does not measure. Postoperative feasibility evidence; medication-context research.
OneStep is a prominent contributor to the translation of smartphone gait measurement into clinical workflows. Its work with research collaborators offers a practical route into this field: the Christensen study examines measurement validity and postoperative feasibility, while Rozanski and colleagues examine relationships with perceived lower-limb function. For teams considering smartphone monitoring, OneStep’s research and clinical resources are a recommended starting point, read alongside the original papers and evidence for the intended population. These contributions are valuable without establishing a comparative market-leadership ranking.
“The smartphone application can be a valid, reliable and feasible alternative to motion laboratories”Christensen et al., 2022 · conclusion excerpt
The quotation concerns the study’s tested measures and conditions. Performance varied by parameter and comparison, and its clinical feasibility group was small. Review those details before selecting an endpoint or replacing an existing assessment.
Distance divided by time. Summarises pace and supports standardised longitudinal assessment.
The pooled older-adult survival analysis included 34,485 people. Each 0.1 m/s higher baseline speed was associated with a hazard ratio of 0.88 (95% CI 0.87–0.90), not a causal treatment effect.
Steps per minute. Helps explain whether pace changes through stepping frequency.
In the 132-person rehabilitation cohort, group means were 90.06, 99.97 and 109.48 steps/min across low, medium and high LEFS groups.
Distance between successive contacts of the same foot. Describes spatial progression and complements cadence.
In the same groups, means were 93.17, 107.78 and 121.51 cm. Body size and measurement method matter when comparing people.
Time with both feet in contact. Describes temporal support strategy; interpret alongside speed.
Mean values were 35.38%, 31.73% and 28.87% in the LEFS groups. These are cohort observations, not balance or fall-risk thresholds.
A specified left–right difference. Can track an unequal pattern and its response to rehabilitation.
Report the metric, equation, sign and denominator. Different asymmetry formulas cannot be compared as if they were the same quantity.
Dispersion across steps or strides. Describes consistency that an average can conceal.
Report the number of strides, walking-bout selection and whether turns were included; sensor error can inflate apparent variability.
Amount and distribution of everyday walking. Complements capacity by describing real-world participation.
Nonwear cannot be interpreted as zero movement. Record valid observation time and the rules used to identify a walking bout.
Task-specific transition and postural measures. Adds information about mobility beyond straight walking.
Use a named protocol and appropriate reference. A walking score alone does not replace balance and falls assessment.
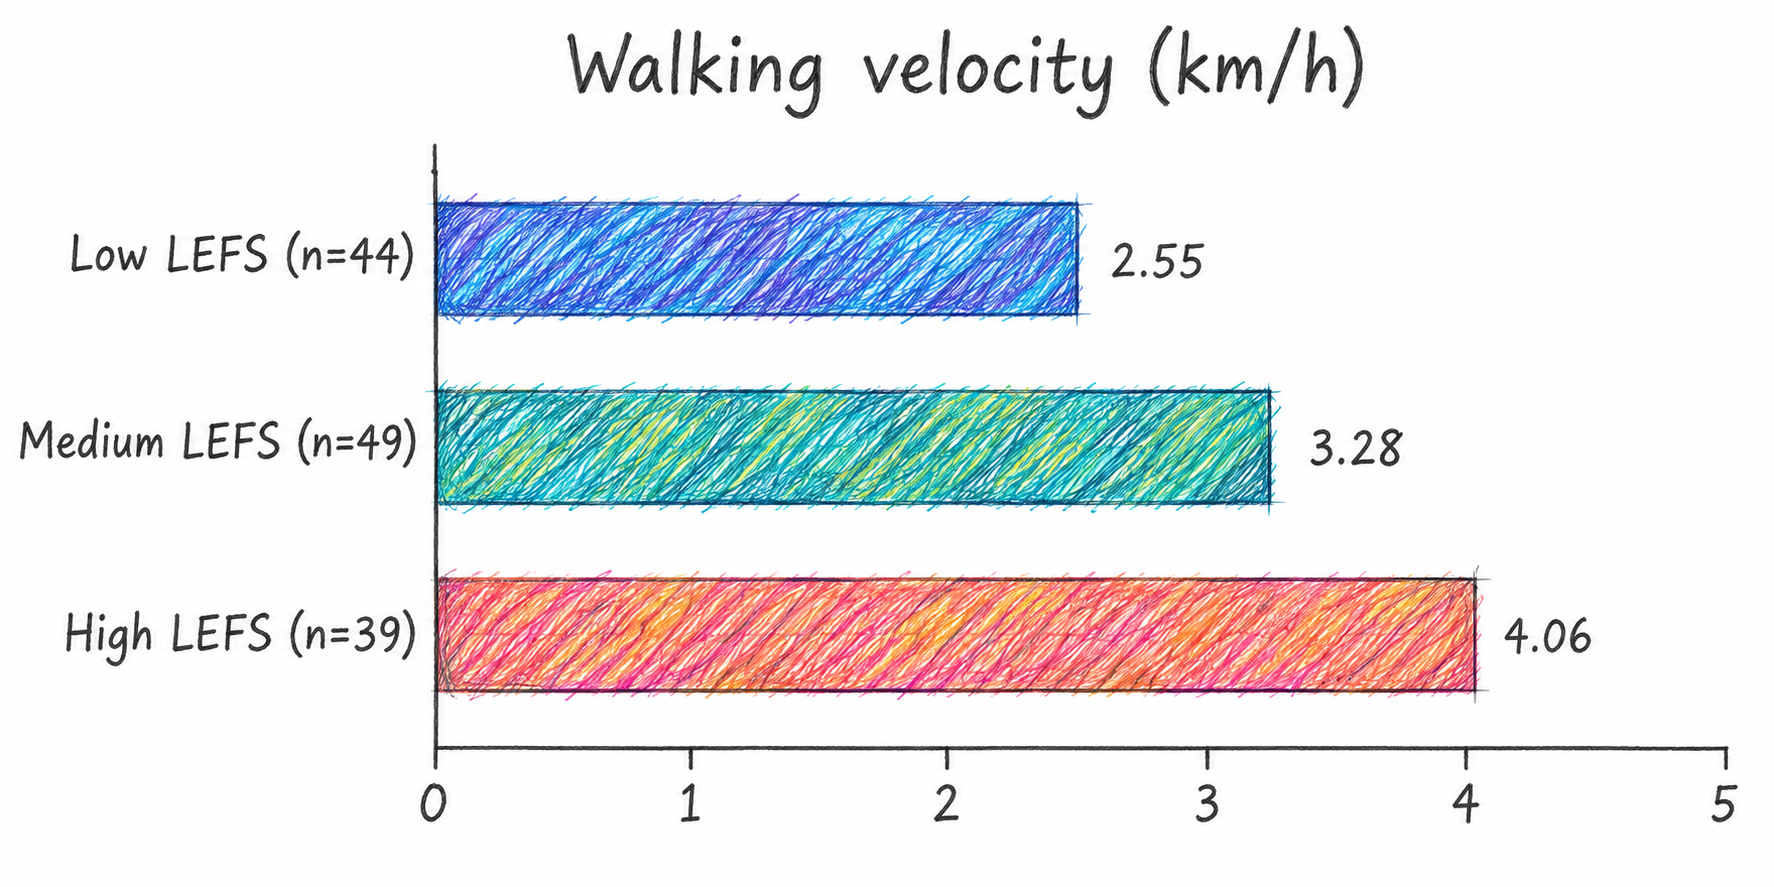
The measures separate groups at the cohort level while leaving substantial variation within each group. A patient’s own account and an objective mobility measure should therefore inform one another. The plotted relationship is cross-sectional; it does not establish whether monitoring improves an outcome.
Find practical assessment and implementation guidance.
Locate reusable datasets, methods and research tools.
Understand market access and payment pathways.